
Life Cycle Assessment, Part 2: example carbon assessment for a Passivhaus building.

Originally posted 28th October 2020
A longer read: 8 to 10 minutes.
This post follows directly from the last two, which looked at ways to compare the embodied carbon of different materials (https://www.sustainablebuildconsultancy.com/blog/embodiedcarbon), and how to apply that to the lifespan of a building using whole building life cycle assessment (https://www.sustainablebuildconsultancy.com/blog/lca1).
This post puts that into practice with an example using life cycle assessment to compare the differing carbon impacts of different options for a passivhaus design. It might make more sense if you’ve read Part 1 first (estimated 3.5 minute read) but I’ve tried to explain the key principles again here throughout.
Whole building Life Cycle Assessment (LCA)
The comparison data below was calculated using PHRibbon plug-in to Passivhaus Planning Package (PHPP). If you use PHPP I highly recommend PHRibbon to streamline carbon comparisons (as well as a wealth of other useful features). PHRibbon cross-references quantities of all materials used in a building and their densities against a list of carbon data derived from Environmental Product Declarations (EPDs) and the ICE database of embodied carbon. It also accounts for replacement of components during a building’s lifespan.
Where data for the exact material used wasn’t available the closest match was selected (and indicated where relevant below).
PHRibbon calculations follow the methodology of RICS guidance ‘Whole life carbon assessment for the built environment’ (pdf) (I’m grateful to Tim Martell - creator of PHRibbon - for pointing me to that document, a very useful read).
The building
For this exercise I modelled a simple Passivhaus building in PHPP, using climate data appropriate for my own location. I then used PHRibbon to explore life-cycle embodied and operational carbon of two different floor options and two different wall options. The operational energy is the same for all options explored, so the differences are down to the varied embodied carbon of the materials (with the exception of the final comparisons between gas boiler and airsource heatpump, where the different efficiencies of the technologies affect the amount energy used).
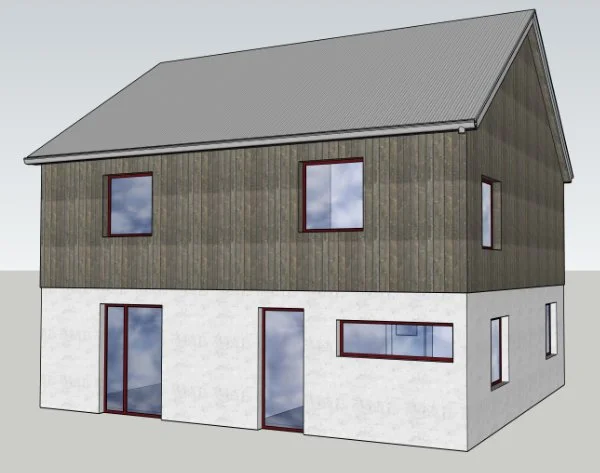
It’s a 112 m² three-double-bedroom house (image below), with room for a home office (or separate dining room, depending on preference). I’m not an architect so please don’t judge me too harshly on the design. NB: periodic reminder that - although I’ve modelled a house - Passivhaus can be applied equally to domestic and non-domestic buildings, as should low-carbon criteria.
Why Passivhaus? Because it guarantees very low operational energy use whilst maintaining high levels of internal comfort and air quality. This minimises the operational CO₂e.
Technical details of the house for those that are interested (scroll on down if that isn’t you):
Climate data location: Glasgow Airport
Altitude: 200m
U values:
Roof: 0.10 W/m²K
Walls: 0.11 W/m²K
Floor: 0.10 W/m²K
Average installed window/door: 0.82 W/m²K
Treated Floor Area: 112 m²
Theoretical airtest result: 0.6 1/h @50pa
Heating demand: 14 kWh/m²/year
Heating load: 12 W/m²
Form factor: 3.1
Options
The embodied carbon calculations take account of the differing volumes (and densities) of different insulation materials needed to achieve the same operational energy performance.
The life span of the building is given as 60 years (the default).
Floor options:
Option 1: Reinforced concrete floor slab, insulated with extruded polystyrene (XPS).
Option 2: Limecrete floor slab, insulated with foamed glass aggregate.
Both options: Cellulose fibre insulation in timber frame walls and at rafter level.
Wall options:
Option 1: Polyurethane insulation in timber frame wall.
Option 2: Cellulose fibre insulation in timber frame wall.
Both options: Cellulose fibre insulation at rafter level, reinforced concrete floor slab insulated with extruded polystyrene (XPS).
Transport distances are estimated by average distance according to country of origin of material: 350km total distance for products from the UK, 1550km for products from the EU (the last 50km in both cases being in smaller local delivery vehicles). To make results more accurate and project specific you could calculate the distance from manufacturer to site: this would likely include a number of different depots, wholesalers and suppliers along the way.
I’ll look first at the life cycle embodied carbon of the two options, then at the combined operational and embodied carbon with different heating systems (gas vs. heat-pump).
The carbon emissions are expressed as CO₂e, accounting for the Global Warming Potential (GWP) of all gas emissions, converted to an amount of Carbon Dioxide with an equivalent GWP.
The results are not intended to be in any way definitive, but to demonstrate some of the issues involved in assessing life cycle carbon emissions.
Part 1: Life cycle embodied carbon
Below are two charts showing the embodied CO₂e at start of life (manufacture of materials and construction of building) and end of life (manufacture and construction emissions, plus demolition and disposal emissions) for the whole building with the different options for floor (first chart) and wall (second chart).
Carbon storage (sequestration) of timber based products is included (leading to negative figures at start of life - as the figures are for the whole building all options include a significant amount of timber and cellulose fibre). The RICS methodology used by PHRibbon sensibly states that sequestration should only be included where the LCA includes end of life stages, and where timber is sourced from certifiably sustainable sources (otherwise the true impacts would be ignored).
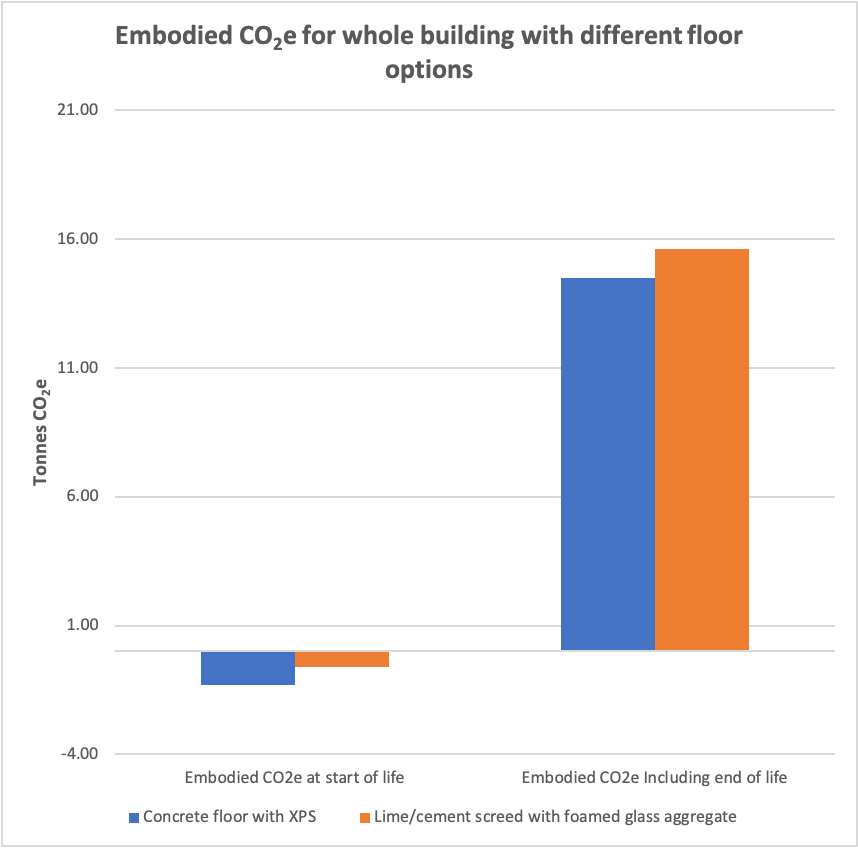

A note on the floor comparison (left-hand chart above):
There isn’t an exact match in PHRibbon for limecrete floor, which may affect the accuracy of results. The data for limecrete is based on ‘Screed, mortar (1:2:9 Cement:Lime:Sand mix)’. It is frustratingly hard to get reliable embodied carbon data for lime products, and I hope producers will obtain EPDs soon to improve the information available. ICE notes the difficulty, but gives lime products a lower average CO₂e/kg than cement (the exact CO₂e varies a lot depending on exact type of cement, with similar variation likely for different lime products). Lime is generally used in larger volumes per mix than cement would be, but is less dense - comparisons here are complicated! Both products can absorb some CO₂ as they cure, with lime generally absorbing more. The PHRibbon data accounts for absorption of CO₂ by the concrete slab but not the lime slab - in reality carbon absorption by the lime might slightly close the gap between the two options (but see below: in this case it’s the transport emissions that make the greatest difference).
Overall comparisons
Clearly, the greatest emissions are at end of life in all cases shown, with deconstruction and disposal accounting for more carbon emissions than production and construction. The increase from start of life to end of life emissions is greatest in options using large amounts of bio-based building materials (in this case wood, OSB, and cellulose fibre). Carbon remains stored in these materials until they are removed from the building. Composting (or decomposing in landfill) and incineration release that carbon.
The following paragraph is possibly non-essential, but if like me you need to know why a certain number is used or where it comes from, read on. I went briefly down the rabbit hole of references to find out:
Following the RICS approach, the release of carbon from incineration is equal to the amount sequestered in the timber (which seems logical). In the case of landfilled timber (or derivative products) the carbon release is 2.15 kgCO₂e per kg of timber. This conservatively estimates (based on various studies, summarised in the study at this link) that 20% of the carbon in timber decomposes when landfilled. Based on common landfill conditions it assumes this is at least partly anaerobic (i.e: without presence of oxygen), which results in production of methane as well as carbon dioxide. Methane has a much greater global warming potential (GWP) accounting for 2 kg of that total 2.15 kgCO₂e per kg of timber. The emissions associated with the processing of inert waste for landfill are given as 0.013 kgCO₂e.
Whether inert or bio-based materials, the implications are clear - the end of life phase is extremely important to consider. The more materials can be re-used or recycled, the lower the life-cycle embodied carbon will be. I’d argue it’s also good to design buildings to remain useful for as long as possible. The more a building can be adapted for different needs over time, or be designed from the start to cope with future needs and climate conditions - then the longer it can remain useful and the lower the overall emissions from construction will be. This is also a key argument for retrofit - keeping existing structures in place wherever possible avoids the end of life emissions and reduces construction emissions.
Comparing the floor options
Perhaps counter intuitively the concrete and XPS floor comes in as lower carbon. XPS is oil-derived whereas foamed-glass aggregate (FGA) is made from recycled material; lime concrete is held to be lower-carbon per kilogram than cement concrete (but see first paragraph below the charts above - it’s complicated). The XPS/concrete floor clearly has lower life cycle CO₂e than the foamed-glass/limecrete floor; why?
The prime cause is transport emissions. Currently FGA is not made in the UK but imported from mainland Europe. Closer to the factory the results of the LCA would be different, but in the UK the transport emissions for the FGA are 1.743 Tonnes CO₂e - significantly higher than the 0.044 tonnes CO₂e for the XPS. This is a factor of distance, but also of bulk and density: 53 cubic metres (8 tonnes) of FGA are needed to achieve the same thermal performance as 21 cubic metres (0.7 tonnes) of XPS (for the modelled building). This increased bulk and density also leads to the FGA having greater end of life emissions than the XPS, and more energy is needed to transport the FGA away from the site (regardless of where the FGA is manufactured).
Not included in this analysis is the impact of different ground works for each option. The greater depth of the FGA would require deeper excavations. However, the XPS would require some excavation below the depth of the insulation and backfilling with aggregate. Ideally the impact of the backfill aggregate would be included, and the impact of the different excavations.
In any LCA there are decisions to be made about where you draw the boundaries, and what to leave out. It’s important to state the assumptions and boundaries used, to assist transparent comparison with other buildings.
In brief: the option generally touted as the most environmentally friendly (foamed glass aggregate and limecrete) might not be, as the extruded polystyrene and concrete floor is calculated as lower carbon life cycle carbon. This is largely to due to the different transport distances of each, exacerbated by the much greater volume and mass needed of the foamed glass aggregate to achieve the same thermal performance as the expanded polystyrene. However, the results may be different when other factors are included . When the difference between two options is smaller, it might be time to look more closely at other practical benefits/disadvantages of each and particularly at the resource depletion and ecological harm indicators on EPDs.
Comparison of wall options
The results of this comparison are simpler to compare, and more as I expected. The largest emissions at start and end of life come from the option with polyurethane (PUR) insulation board. Using PUR instead of cellulose fibre increases life cycle embodied carbon by 6.3 tonnes CO₂e. In this case a 1.8 times greater volume of cellulose fibre is needed to achieve the same thermal performance as PUR, but despite this the embodied CO₂e of the PUR is 1.45 times higher. PUR is an oil-based material, cellulose fibre is made from recycled paper - clearly the greater resource depletion also comes from using PUR.
Excluded from this comparison is the effect of structural timber within the wall. The cellulose wall would need to be wider than a PUR wall which might involve a greater amount of timber, depending on structural design.
Part 2: Cumulative life cycle emissions
Below are two charts showing the cumulative emissions by year of operational and embodied CO₂e for two different construction options, with heating supplied alternatively by heat pump (first chart) or condensing gas boiler (second chart). As above, all options are for a passivhaus building with identical thermal performance. (These two charts are generated directly by PHRibbon).
Option 1 (blue line): PUR wall insulation, lime/cement screed and foamed glass aggregate floor.
Option 2 (orange line): Cellulose fibre wall insulation, reinforced concrete and XPS floor.
Option 1 combines the two options from Part 1 with the highest life cycle embodied carbon; Option 2 combines the two with the lowest.
NB: please note the different scales on the vertical axes - cumulative emissions with a gas boiler are much greater than a quick visual comparison might suggest.
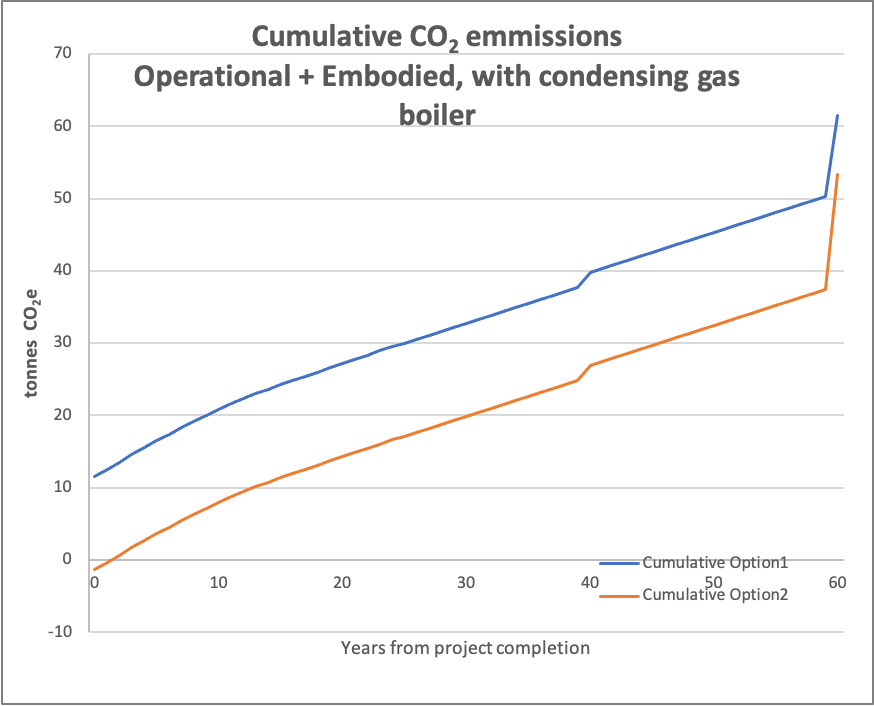
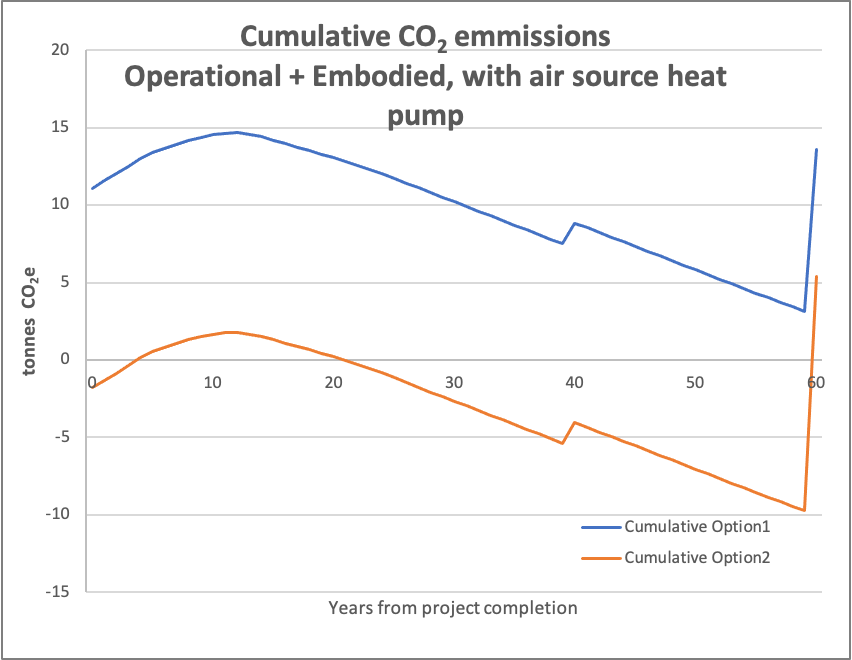
The bump in the lines around the 40 year mark represents the increase in emissions due to replacement of windows.
The lines for the two options on each chart are parallel as both options provide the same (Passivhaus) level of energy efficiency. The gap between the two closes a little at end of life though, where disposal emissions from Option 2 (orange lines) are greater than the Option 1 (blue lines). Crucially, regardless of choice of type of heating, Option 2 produces the lowest cumulative life cycle operational and embodied carbon emissions. If the building is used for longer than 60 years then those end of life emissions are avoided for longer, and Option 2 remains significantly lower carbon.
The charts also lay bare the impact of the choice of heat source. Using a condensing gas boiler rather than an air-source heat pump increases the 60-year life cycle emissions by 47 tonnes CO₂e.
The changing emissions factors (the amount of CO₂e produced for each kWh energy) for electricity over time are based on UK Government and National Grid projections, accounting for likely increase in renewable generation and decrease in fossil fuels. Other assumptions affecting the calculations above are given at the end of this post.
Conclusions
Assessing the carbon impact of a building is complicated. There are many variables involved and a number of pitfalls to watch out for. Using tools to calculate the cumulative life cycle operational and embodied carbon emissions of a building helps see the combined effect of different variables and provides a basis for informed choices of genuinely low-carbon building solutions.
Next: brief follow up post showing the proportions of the total life cycle carbon from embodied and operational emissions: https://www.sustainablebuildconsultancy.com/blog/lca3
Assumptions (from PHRibbon, following RICs methodology):
End of life:
Inert materials: 90% recycled, 10% landfilled
Timber and cellulose materials: 75% incinerated, 25% landfilled
Oil-based materials: 100% landfilled.
Other:
Re-carbonation of modelled concrete slab aborbs 248kg CO₂e
Re-carbonation of limecrete slab not calculated.